The environmental impact of Google Gemini AI text prompts
Google has published the first breakdown of an in-production, global fleet-level AI system serving real queries. Results show per text prompt energy consumption of 0.24 Wh.


Following high level AI environmental numbers from OpenAI and Mistral, Google just published a detailed technical report about the environmental impact of Gemini AI.
Let’s walk through the paper.
System boundary
This report provides real numbers - not estimates - energy per prompt is metered in production and emissions and water are computed from fleet‑average factors (market‑based emissions, on‑site WUE) with amortized embodied hardware. Unlike other publications which focus on theoretical modeling or measurements on limited scale systems, Google has included the full serving stack (under their operational control):
Measured power supply across TPUs and GPUs.
Actual utilization in the production fleet.
Host CPU and memory power.
Provisioned idle capacity included for reliability/low‑latency.
Campus‑level PUE applied (data‑center overhead).
Excluded from their methodology are:
Networking: external networks are out of scope; internal DC networking is assessed as negligible (but no quantitative bound published).
End user devices, also because this is outside of Google’s system boundary.
Training and data storage. This is a major exclusion if your goal is to consider the full lifecycle impact (like Mistral did). However, as AI shifts to more “thinking” models which involve test-time compute, the relevance of inference is increasing.
There are very few organizations operating AI at production scale. Google is one of them, which means we can now see the environmental impact of a real AI system.
Metrics
Using Google’s “Comprehensive Approach” which uses metrics across their data center fleet, they calculate the following metrics as of May 2025:
Energy: 0.24 Wh per prompt
GHG emissions: 0.03 gCO2e per prompt
Water consumption: 0.26 mL per prompt
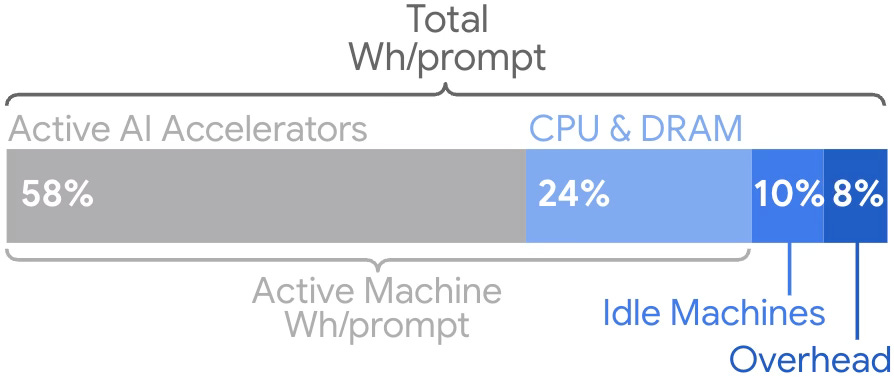
A breakdown of energy consumption by component shows that 58% of the energy goes into the TPUs and GPUs, 24% on CPU and memory, with 18% for operational redundancy and the data center itself.
What is a prompt?
A precise definition of “prompt” is missing, but the technical paper makes several interesting comments:
They “measure total user prompt count across Gemini Apps products for each LLM model” and then “divide each energy component by total user prompt count over the same measured time period to get energy/prompt”.
They also: “measure over a day or longer. This is sufficiently longer than the prompt duration, so partial prompt counts do not measurably impact the results.”
From this:
We find that the distribution of energy/prompt metrics can be skewed, with the skewed outliers varying significantly over time. Part of this skew is driven by small subsets of prompts served by models with low utilization or with high token counts, which consume a disproportionate amount of energy. In such skewed distributions, the arithmetic mean is highly sensitive to these extreme values, making it an unrepresentative measure of typical user’s impact.
This is a pragmatic approach because it considers various types of user text prompts across multiple models, rather than focusing on a single model and specific token lengths. The number of tokens expands as a conversation progresses, so prolonged usage might skew the results especially if you use a mean figure.
Medians reduce sensitivity, but prompt length and low‑utilization conditions still drive the tail - publishing percentiles and per‑token figures would improve comparability.
What doesn’t this tell us?
I’m impressed by the level of detail in Google’s technical report, but it doesn’t tell us everything. There are still questions I’d like to ask:
Emissions calculations are market-based rather than location-based. This makes sense because the calculations are aggregated across Google’s global data center fleet so they are justified in considering their global emissions. Differences in efficiency and carbon intensity through local grid mixes will all be considered in the aggregate number. However, being able to compare location-based emissions would help understand local impact and inform discussions about clean energy purchasing policies. Otherwise it’s too easy to criticize the results as “hiding” emissions in carbon accounting.
Location is also relevant for total water consumption. It’s common for water metrics to only include on-site water (typically used for data center cooling), but a larger component of total water consumption comes from energy generation. Google only includes on-site water consumption.
“Gemini Apps” is ambiguous and not comprehensive. Google has many AI products including Gemini chat, the Google Cloud Gemini APIs, AI Mode & AI Overview in Google Search. The methodology says it covers “all LLM models serving the Gemini app”, which excludes other AI products.
It specifically only covers text prompts. Multi-modal is increasingly common when analyzing files, generating images, and producing video.
Training is excluded. This has so far been where the majority of the energy consumption comes from because of the compute-intensive long running jobs involved.
Google only reports on their owned and operated data center fleet, but they use many other facilities. For example, Google Cloud has a London region but that doesn’t appear in their fleet list because it's operated by a third-party. How efficient are these facilities and are they included in this reporting methodology?
What does this tell us?
Overestimating data center energy has been a hobby of many academics and journalists for over a decade. I’ve written about how many widely cited estimates overstate data‑center energy, water, and other impacts due to outdated assumptions and extrapolation.
Instead, what has actually been happening is:
Multiple models are used for different use cases and phased out as newer generations come in. The exact models aren’t explained, but this is a safe assumption given the number of newly announced models over the analysis period.
New models are significantly more efficient than older models (as reported by Google in 2022). Google’s paper says this amounts to a 33x reduction in per prompt energy consumption driven by software efficiencies (23x from model improvements and 1.4x from improved hardware utilization).
Data center operations are becoming highly efficient, particularly with specialist hardware like TPUs. Google’s paper shows 1.4x improvement in emissions intensity from data center electricity consumption through choosing workload location and clean energy consumption.
As the media hype I predicted continues to exaggerate the environmental impact of AI, we’re now seeing companies respond with real data. This technical report avoids making puritan value judgments by avoiding misleading terms like “thirsty”, “drink”, “power-hungry”, etc. all of which distract from the engineering science.
Google’s technical report is the first time we have a breakdown of an in-production, global fleet-level system. It provides a comprehensive serving boundary and offers concrete deltas over the previous year. The paper is transparent about skew and justifiably uses medians, but not publishing distributional stats e.g. P90/99 or per‑token metrics limits comparability and could hide the worst‑case load.
There is a huge buildout of AI infrastructure under way and it’s likely that total energy consumption related to AI is going to grow. However, I expect efficiency gains, batching, and load‑placement should temper growth versus extrapolations.
The misconception is that AI is destroying the planet, but that is partially the fault of the AI companies because they’ve not been transparent in their energy, water, and emissions data. This is starting to change.