AI data center energy in 2026
US data center electricity use is around 180 TWh today and credible forecasts point to 400-600 TWh by 2030, but chips, grids, politics, and the changing shape of AI workloads make estimates difficult.


The 2010s were the hyperscale efficiency era. Cloud migration, better utilization, virtualization, improved PUE, and more efficient equipment meant digital services could grow without electricity demand rising nearly as fast.
AI changes this. The major AI labs are already deploying into hyperscale facilities, so new capacity is highly efficient from the start. But that also means the biggest historical efficiency lever - moving workloads out of inefficient enterprise data centers and into modern cloud infrastructure - has already been pulled.
That is why the energy question has changed. It is no longer just “how much power does a model use?” It is “how much new electricity demand is the AI buildout creating, where will it appear, and what constrains it?”
A year ago, many public estimates were still weak extrapolations: take the energy cost of a query, multiply by user growth, and call it a forecast. That was never a good way to think about data center energy consumption. Now we have a better set of numbers from LBNL, the IEA, and EPRI.
The latest estimates
Despite the importance of data center energy consumptions, there are still few credible models. My 2022 review of 258 data center energy estimates from 46 original publications between 2007 and 2021 showed only two sources of reliable estimates1.
For the purposes of tracking US and global data center electricity consumption, there are now three sources I treat as the core references:
LBNL 2024 United States Data Center Energy Usage Report
Methodology: US-only, bottom-up model that uses commercial equipment shipment data with utilization and PUE assumptions.
Comment: Best technical baseline for US demand. Strong on equipment stock and utilization; sensitive to GPU shipments, installed base, and operating assumptions.
IEA 2025 Energy and AI
Methodology: Extends the LBNL, 2024 methodology to global scope.
Comment: Best global context. Built from the LBNL-style bottom-up approach, but expanded into an energy-system model. Less useful for understanding where local grid stress appears.
EPRI 2026 Powering Intelligence: Updated Scenarios of U.S. Data Center Electricity Use and Power Strategies
Methodology: Uses existing and announced US data center construction projects to estimate capacity, with assumptions around completion rates and utilization.
Comment: Best grid-planning view. Captures geographic concentration and project pipelines, but depends on noisy announcement and completion assumptions so is more about claims on future power than a direct forecast.
This is a better situation than the one I warned about in 2024, when many AI energy claims were being over-extrapolated from weak public data. These reports are credible, but they are still proxies: equipment shipments, project pipelines, PUE assumptions, load factors, and regional power-system constraints.
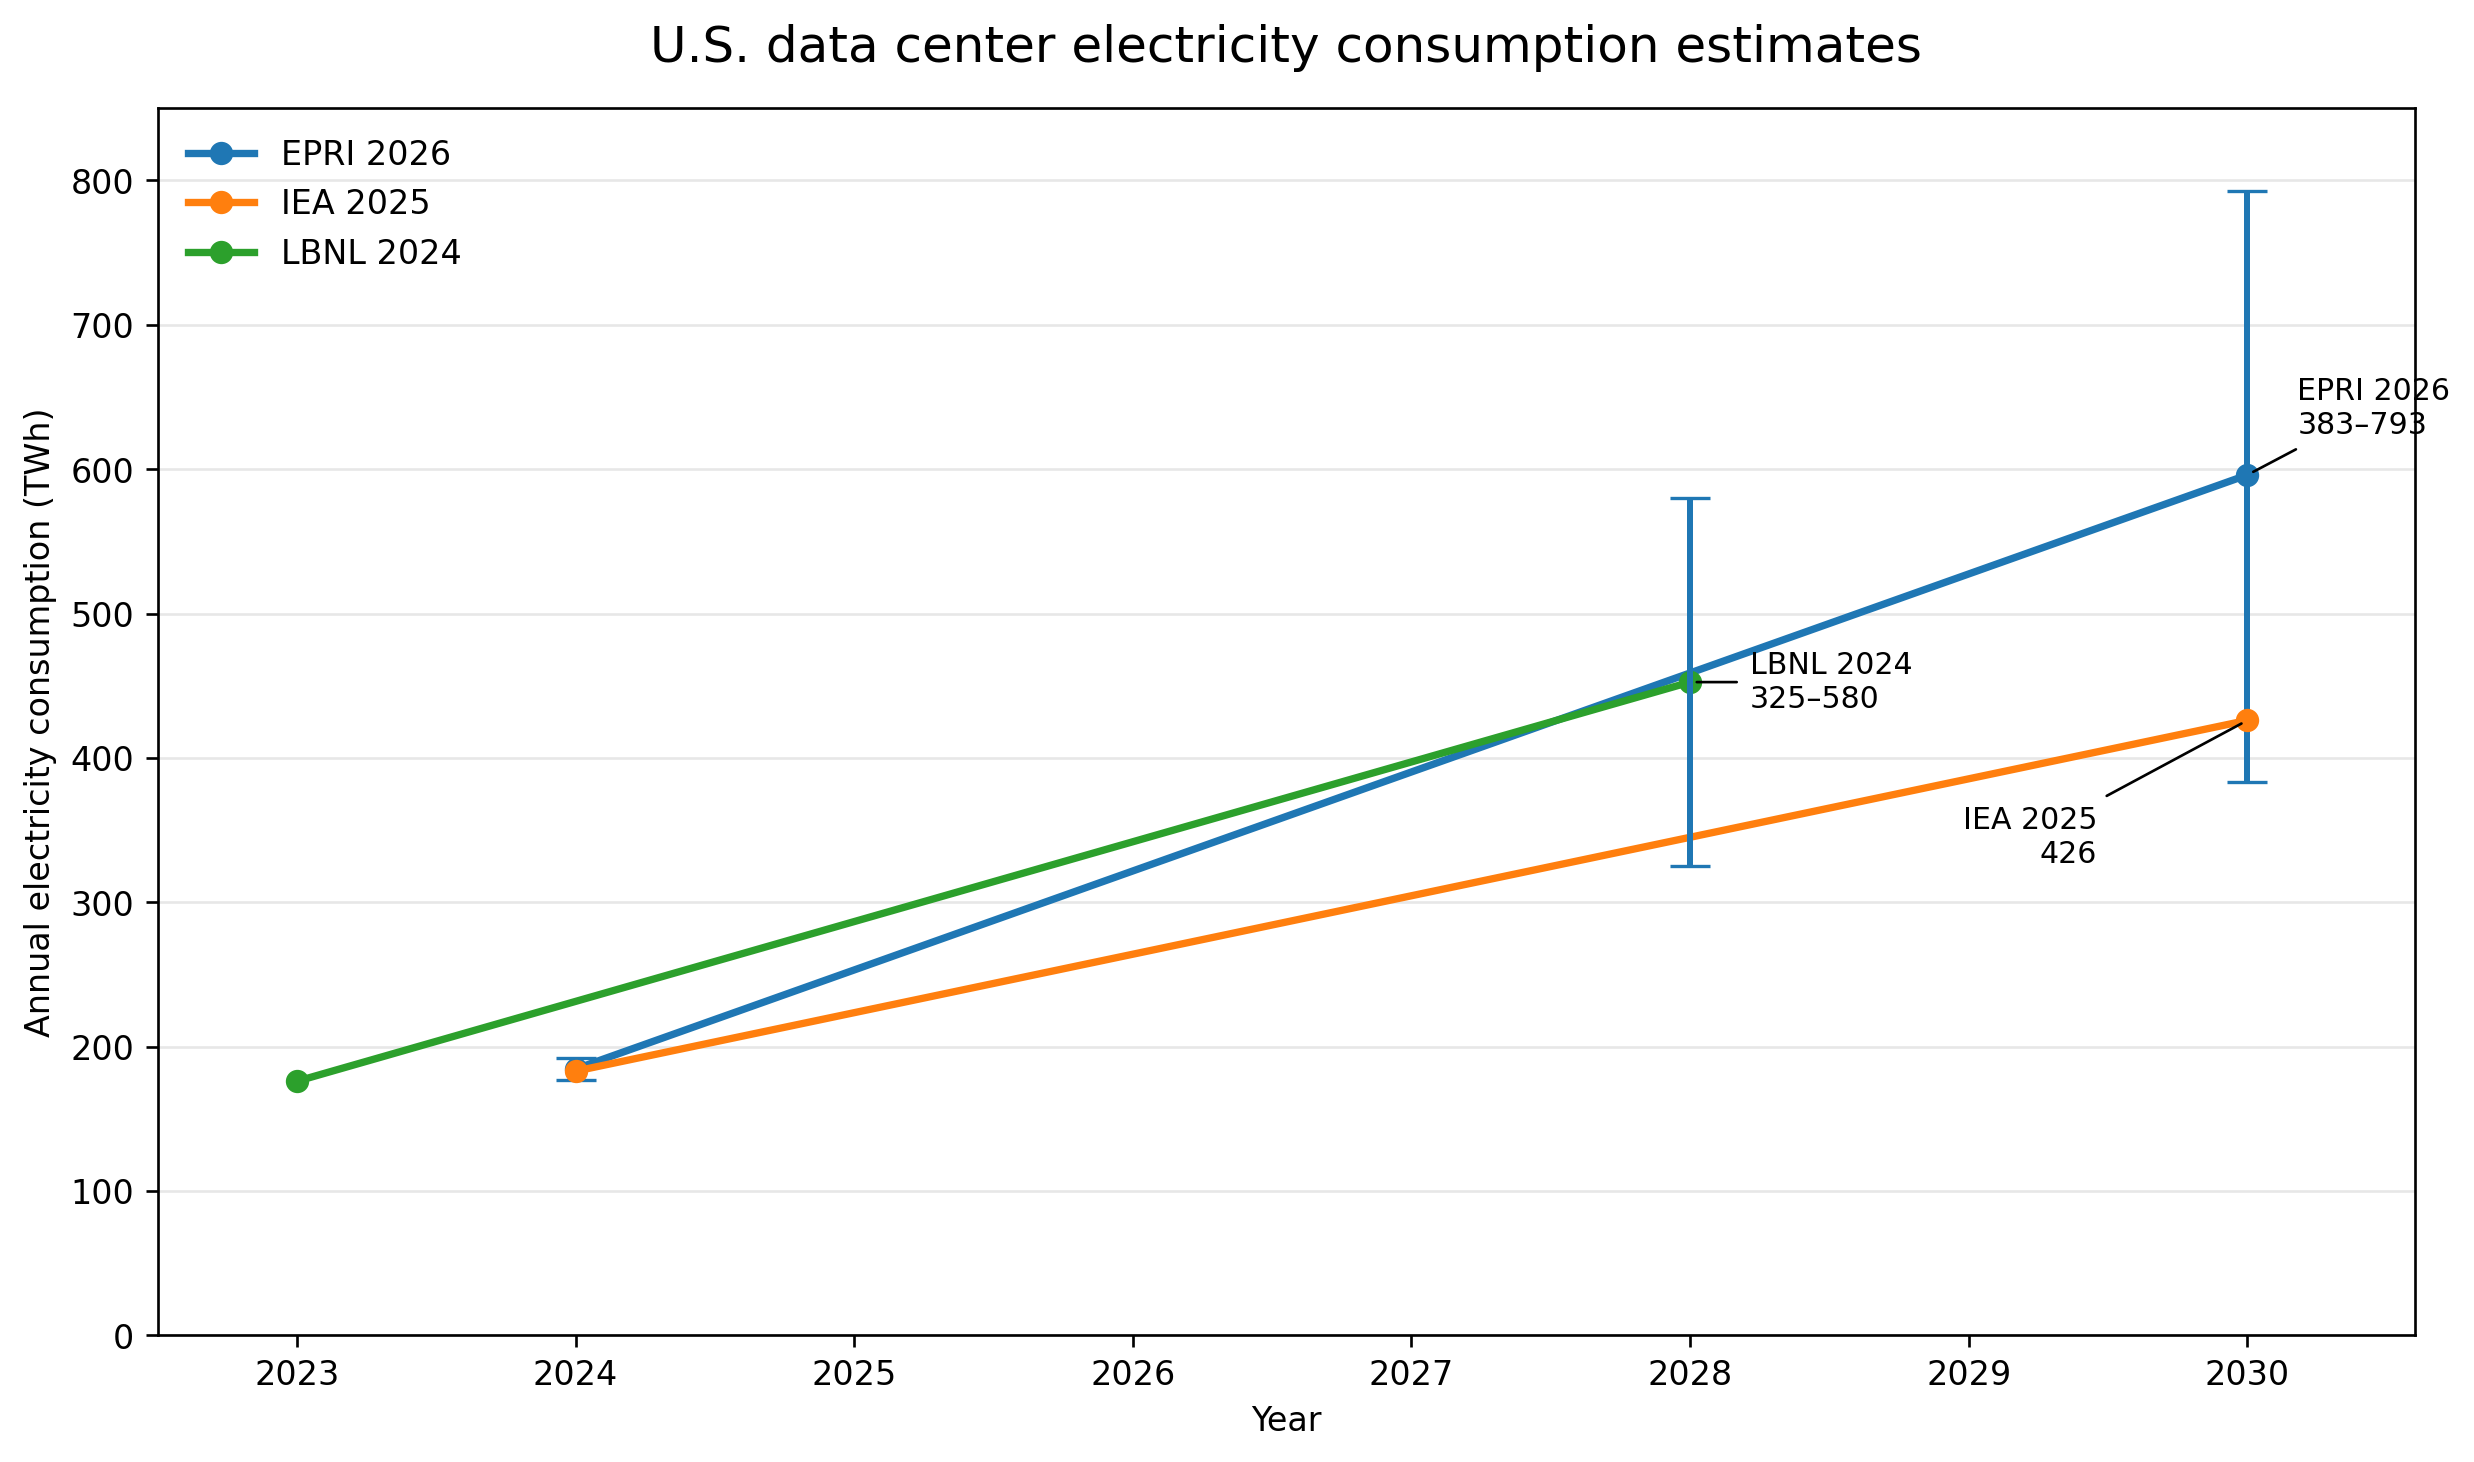
US data center energy consumption numbers
From these sources we can extract the key estimates for the US over the next few years:
2023
176 TWh (LBNL)
2024
183 TWh (IEA)
177-192 TWh (EPRI)
2028
325-580 TWh (LBNL)
2030
426 TWh (IEA)
383-793 TWh (EPRI)
The US data center sector is moving from roughly 180 TWh today toward 400-600 TWh around the end of the decade, with the high-end scenarios going further. The exact number matters less than the scale of the change, which is what makes it difficult for grid planning.
Three things stand out:
First, the historical numbers now broadly line up. That was not true in the past. For years, data center energy estimates varied widely because researchers were working from incomplete data and different assumptions.
Second, the forward estimates are wide but directionally consistent. I’m always skeptical of the extreme range in the high-end scenarios because history shows that the economic incentive to improve efficiency will eventually play out. They’re useful for getting your estimate quoted in the press rather than as a realistic projection of actual consumption.
Third, the uncertainty has shifted to figuring out which constraint turns projected demand into actual consumption: chips, sites, interconnection, power procurement, utilization, economics, politics, or a combination of them all.
The grid constraints
A data center announcement is not electricity consumption - it is a claim on power, land, equipment, cooling, interconnection, and political permission. This makes the EPRI estimate interesting, but it is not measuring the same thing as LBNL. It is closer to a map of where data center developers want the grid to expand i.e. it’s a demand signal - useful, but noisy.
As I argued last year, the bottleneck is not just how much AI companies want to build, but whether the grid can deliver power to the right place at the right time. Transmission, substations, transformers, generation procurement, and behind-the-meter power will determine how much of the pipeline becomes real load.
Historical vs future efficiency gains
Data centers have been here before and we’re seeing the same alarmist claims repeated from the last time data center growth was scrutinized. Digital demand grew rapidly through the 2010s, but electricity consumption did not rise nearly as quickly because of hyperscale migration, virtualization, higher utilization, better equipment, and improved PUE.
However, the major AI labs are not moving from inefficient enterprise server rooms into modern cloud data centers. They are starting there. That means the biggest historical efficiency tools have already been used. Future gains will have to come from better accelerators, better model architectures, higher utilization, better scheduling, inference optimization, and possibly smaller models doing more of the work.
We’re already seeing significant progress with hardware efficiency at the hyperscalers, for example with Amazon’s latest Trainium and Graviton chips which they highlighted in their latest Q1 2026 earnings:
Our Trainium2 chip has about 30% better price performance than comparable GPUs and is largely sold out. Trainium3, which just started shipping in 2026 and is 30% to 40% more price performant than Trainium2, is nearly fully subscribed…Meta chose Graviton, which delivers up to 40% better price performance than any other x86 processors, and is now used by 98% of the top 1,000 EC2 customers.
The economic incentive exists to make these improvements and reduce costs as we have seen from the 75% cost reduction2 for DeepSeek v4, but if demand is elastic, cheaper inference will increase total usage even as energy per task falls.
AI changes usage profiles
One reason the forecasts are hard is that “AI workload” is a moving target.
In a short period, we have moved through at least three usage patterns: chat, reasoning, and agents. Chat made inference visible. Reasoning models increased the number of tokens generated per task. Agents change the trigger so that instead of a human asking one question, software can decompose a problem into many model calls, tool calls, retrieval steps, and verification loops. Focusing just on the prompt means you miss everything else that happens after.
The earlier AI energy debate focused heavily on training runs and GPU inference. These are now components in a larger system: GPU inference embedded inside longer workflows coordinated by conventional cloud infrastructure - CPUs, memory, storage, networking, queues, databases, retrieval systems, and caches.
Amazon serves as an example of this happening in hyperscale environments. Again, from their Q1 2026 earnings:
AI is commonly seen as a GPU story, but the rise of agentic workloads, real-time reasoning, code generation, learning, and multi-step task orchestration is driving massive CPU demand as well. As AI systems shift from answering questions to taking actions, and as post-training and inference scale up, the compute required falls heavily on CPUs.
That changes how we should think about utilization and where energy consumption is concentrated. A large training run is relatively easy to model - many GPUs running at high utilization in a centralized data center. Agentic inference is complex. It may involve many smaller, variable workloads spread across different systems, with more orchestration overhead and more dependence on the surrounding stack.
This does not mean edge computing suddenly replaces hyperscale. The major AI labs are still deploying at hyperscale, and hyperscale remains the most efficient place to run large workloads. But it does mean AI energy forecasting cannot only be a GPU-counting exercise. It has to account for the whole workflow.
So what’s the latest on AI energy
US data center electricity use is rising and AI is a major driver. The newest credible estimates agree on that, even though they do not agree precisely on the trajectory.
LBNL, IEA, and EPRI have different views of the bottleneck. Equipment models show what the hardware could consume. Project-pipeline models show where developers want power. Energy-system models show what has to be built around that demand.
We are now in a period of intense growth and industrialization. The next question is not simply whether AI will use 400 TWh, 600 TWh, or 800 TWh in the US by the end of the decade, but which constraint has the most impact: chips, data centers, grid connections, power supply, capital, politics, or demand.
That is why AI energy is not just an energy story. It is a story about what happens when useful AI becomes cheaper, more capable, and more continuous.
LBNL and Borderstep produced the two credible models I’ve previously used. Borderstep has not published a recent, English-language estimate, so isn’t included in this discussion.
This was an introductory rate, but the “cached” response price reductions are permanently 1/10th of the previous pricing. Caching is another example of efficiency optimizations.